Research
(Advertisement)
Bitcoin, Ethereum, and Solana Struggle for Direction After Late-November Shakeout

After a late-November scare, Bitcoin, Ethereum, and Solana are consolidating below key levels, reflecting cautious sentiment and unclear short-term direction.
Miracle Nwokwu
December 13, 2025
(Advertisement)
Table of Contents
Bitcoin endured one of its roughest months of the year in November, with price action turning sharply lower and briefly threatening the psychological $80,000 region. The sell-off came amid a broader risk-off mood across global markets, reinforced by the most recent FOMC outcome, which signaled a more cautious stance on rate cuts than many traders had hoped for. That macro backdrop weighed heavily on crypto, triggering liquidations and forcing a reset after months of strong upside momentum.
As December unfolds, Bitcoin, Ethereum, and Solana are all attempting to stabilize, but the charts show that the market remains at a technical crossroads.
Bitcoin (BTC/USDT): Stabilization After a Sharp Breakdown
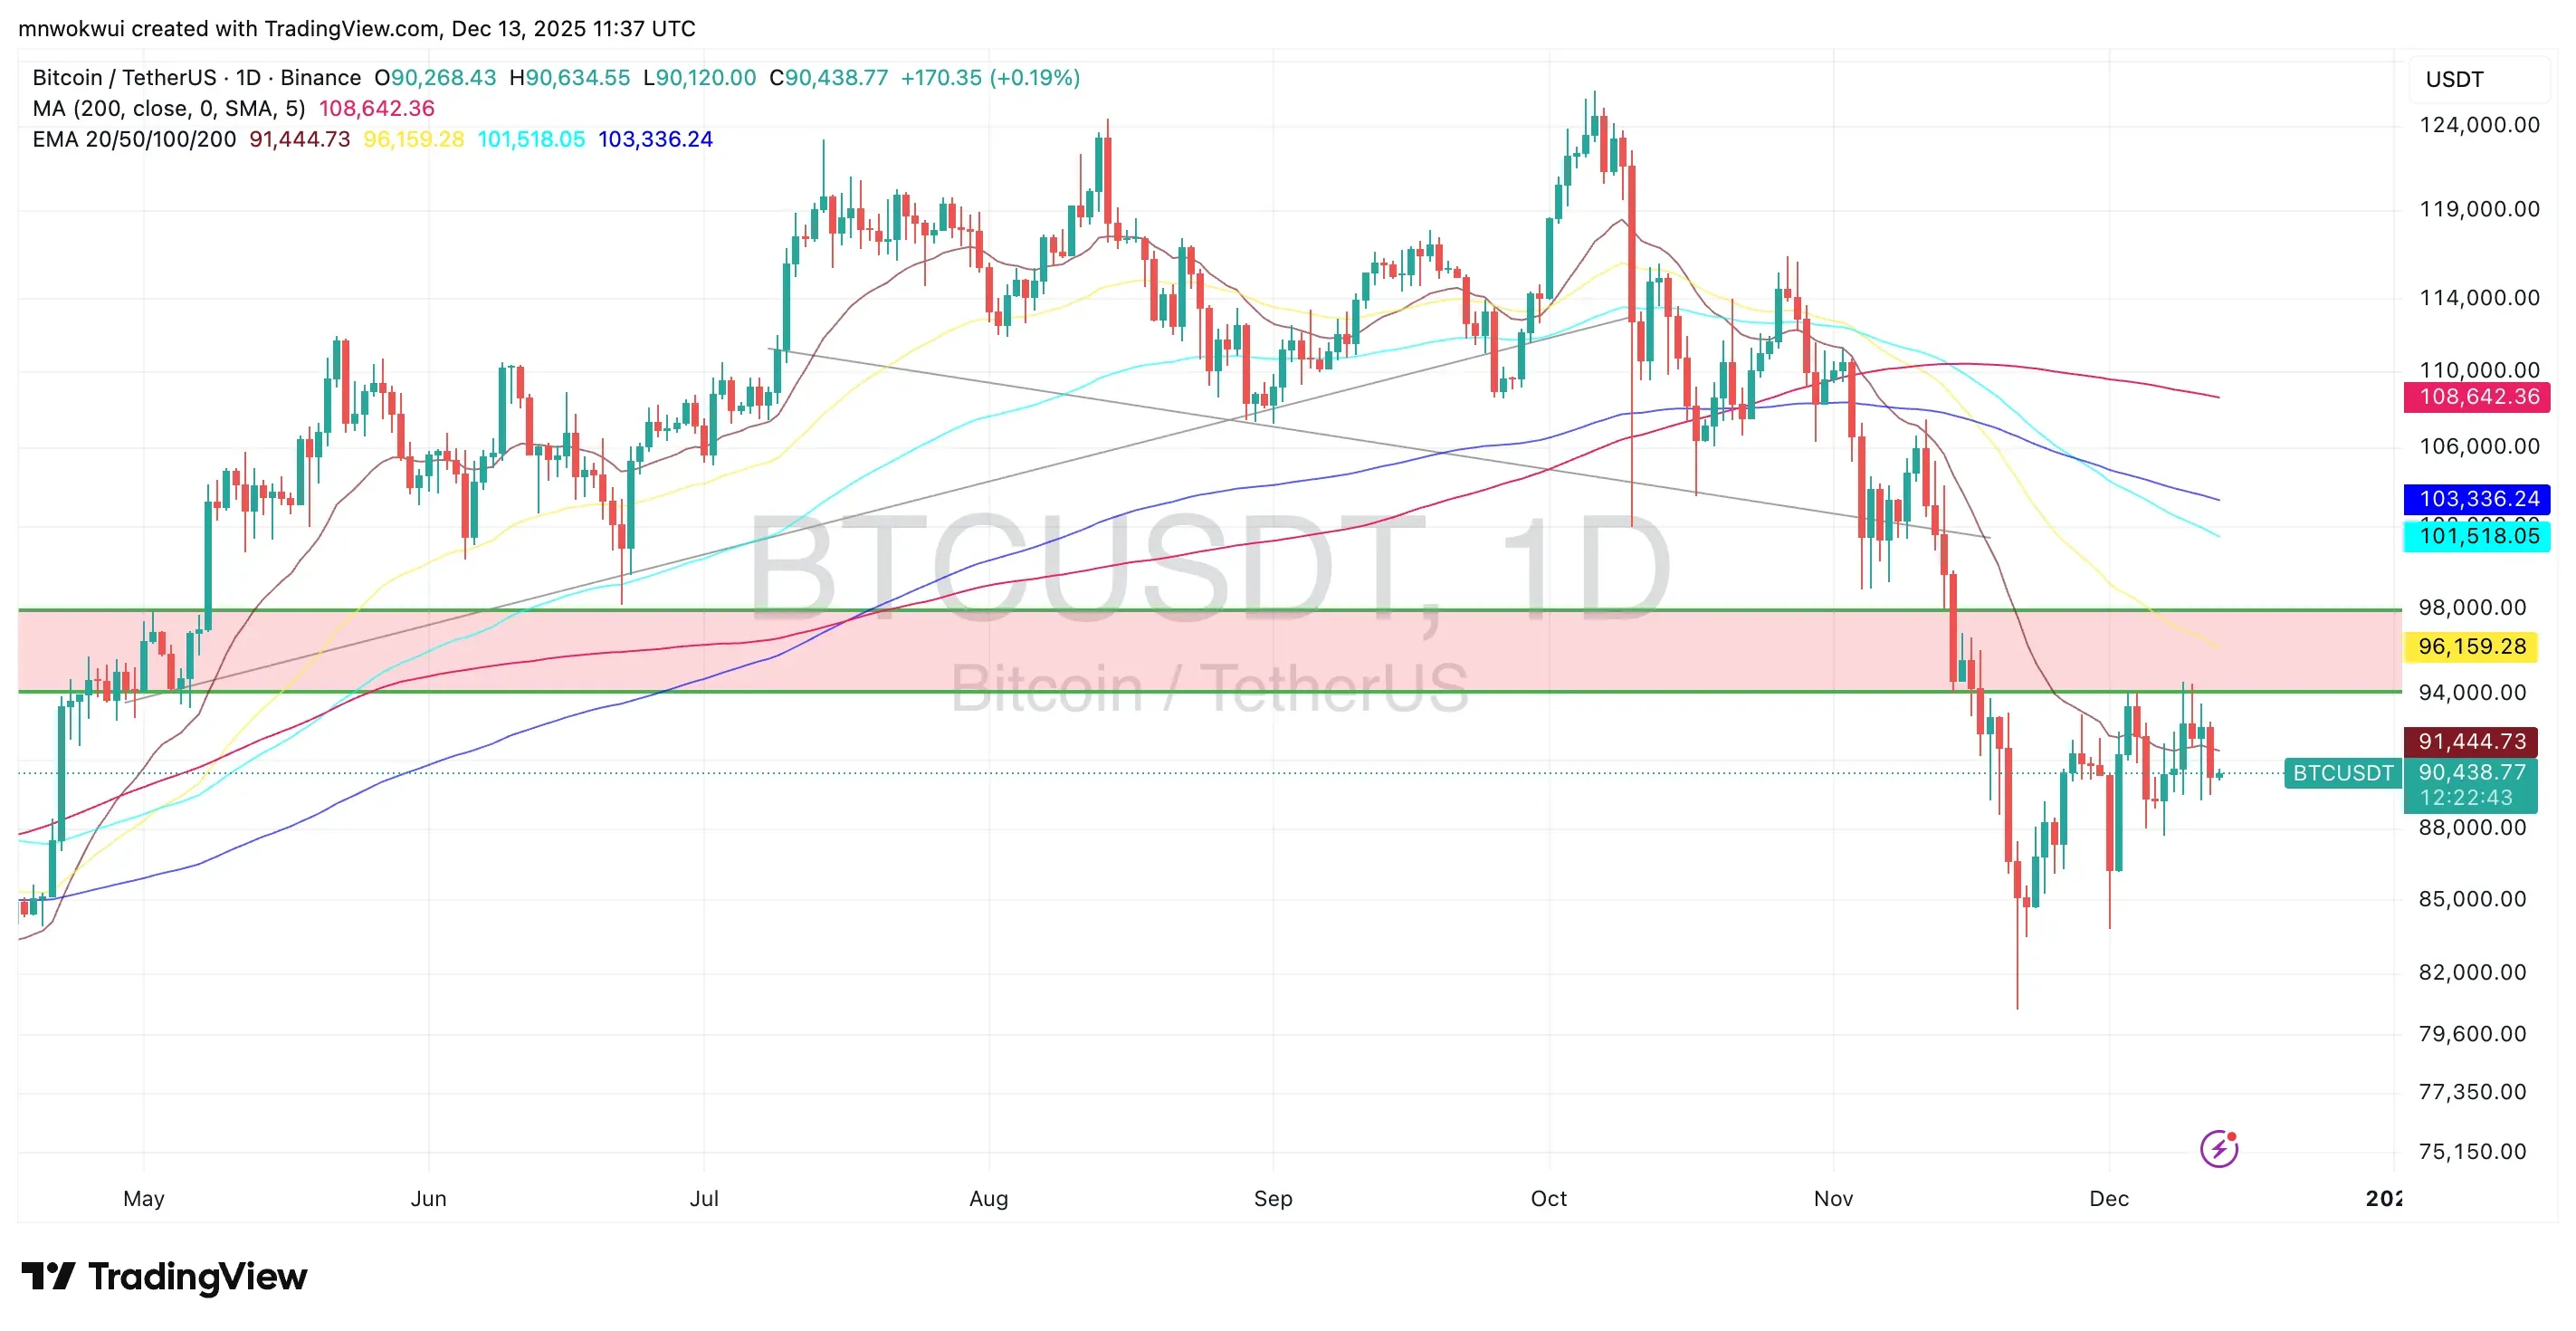
From late November, Bitcoin saw a decisive breakdown below its mid-range support zone around $94,000–$98,000, an area that had previously acted as a demand region throughout September and October. The loss of this zone accelerated downside pressure, sending BTC toward the low-$80,000s before buyers stepped in aggressively.

Since then, price action has shifted into a consolidation phase. Bitcoin is currently trading around the $90,000–$92,000 region, hovering below its short-term moving averages. Notably, BTC remains under the 20-day and 50-day EMAs, while the 100-day EMA sits overhead near the $101,000–$103,000 zone, reinforcing a layered resistance structure.
Bullish scenario:
For bulls, the key signal to watch is a sustained daily close back above the $94,000–$98,000 range. A successful reclaim of this former support, especially if accompanied by rising volume, would suggest that the late-November breakdown was a liquidity sweep rather than the start of a deeper bear phase. In that case, Bitcoin could target the $103,000 area first, followed by a potential retest of the $108,000–$110,000 region where the 200-day moving average currently resides.
Bearish scenario:
On the downside, failure to hold above $88,000 would expose Bitcoin to renewed selling pressure. A clean break below this level could open the door to another move toward the November lows in the $82,000–$85,000 range. Losing that support would significantly weaken the broader structure and raise the risk of a deeper correction into early 2026.
Ethereum (ETH/USDT): Compression Below Key Resistance
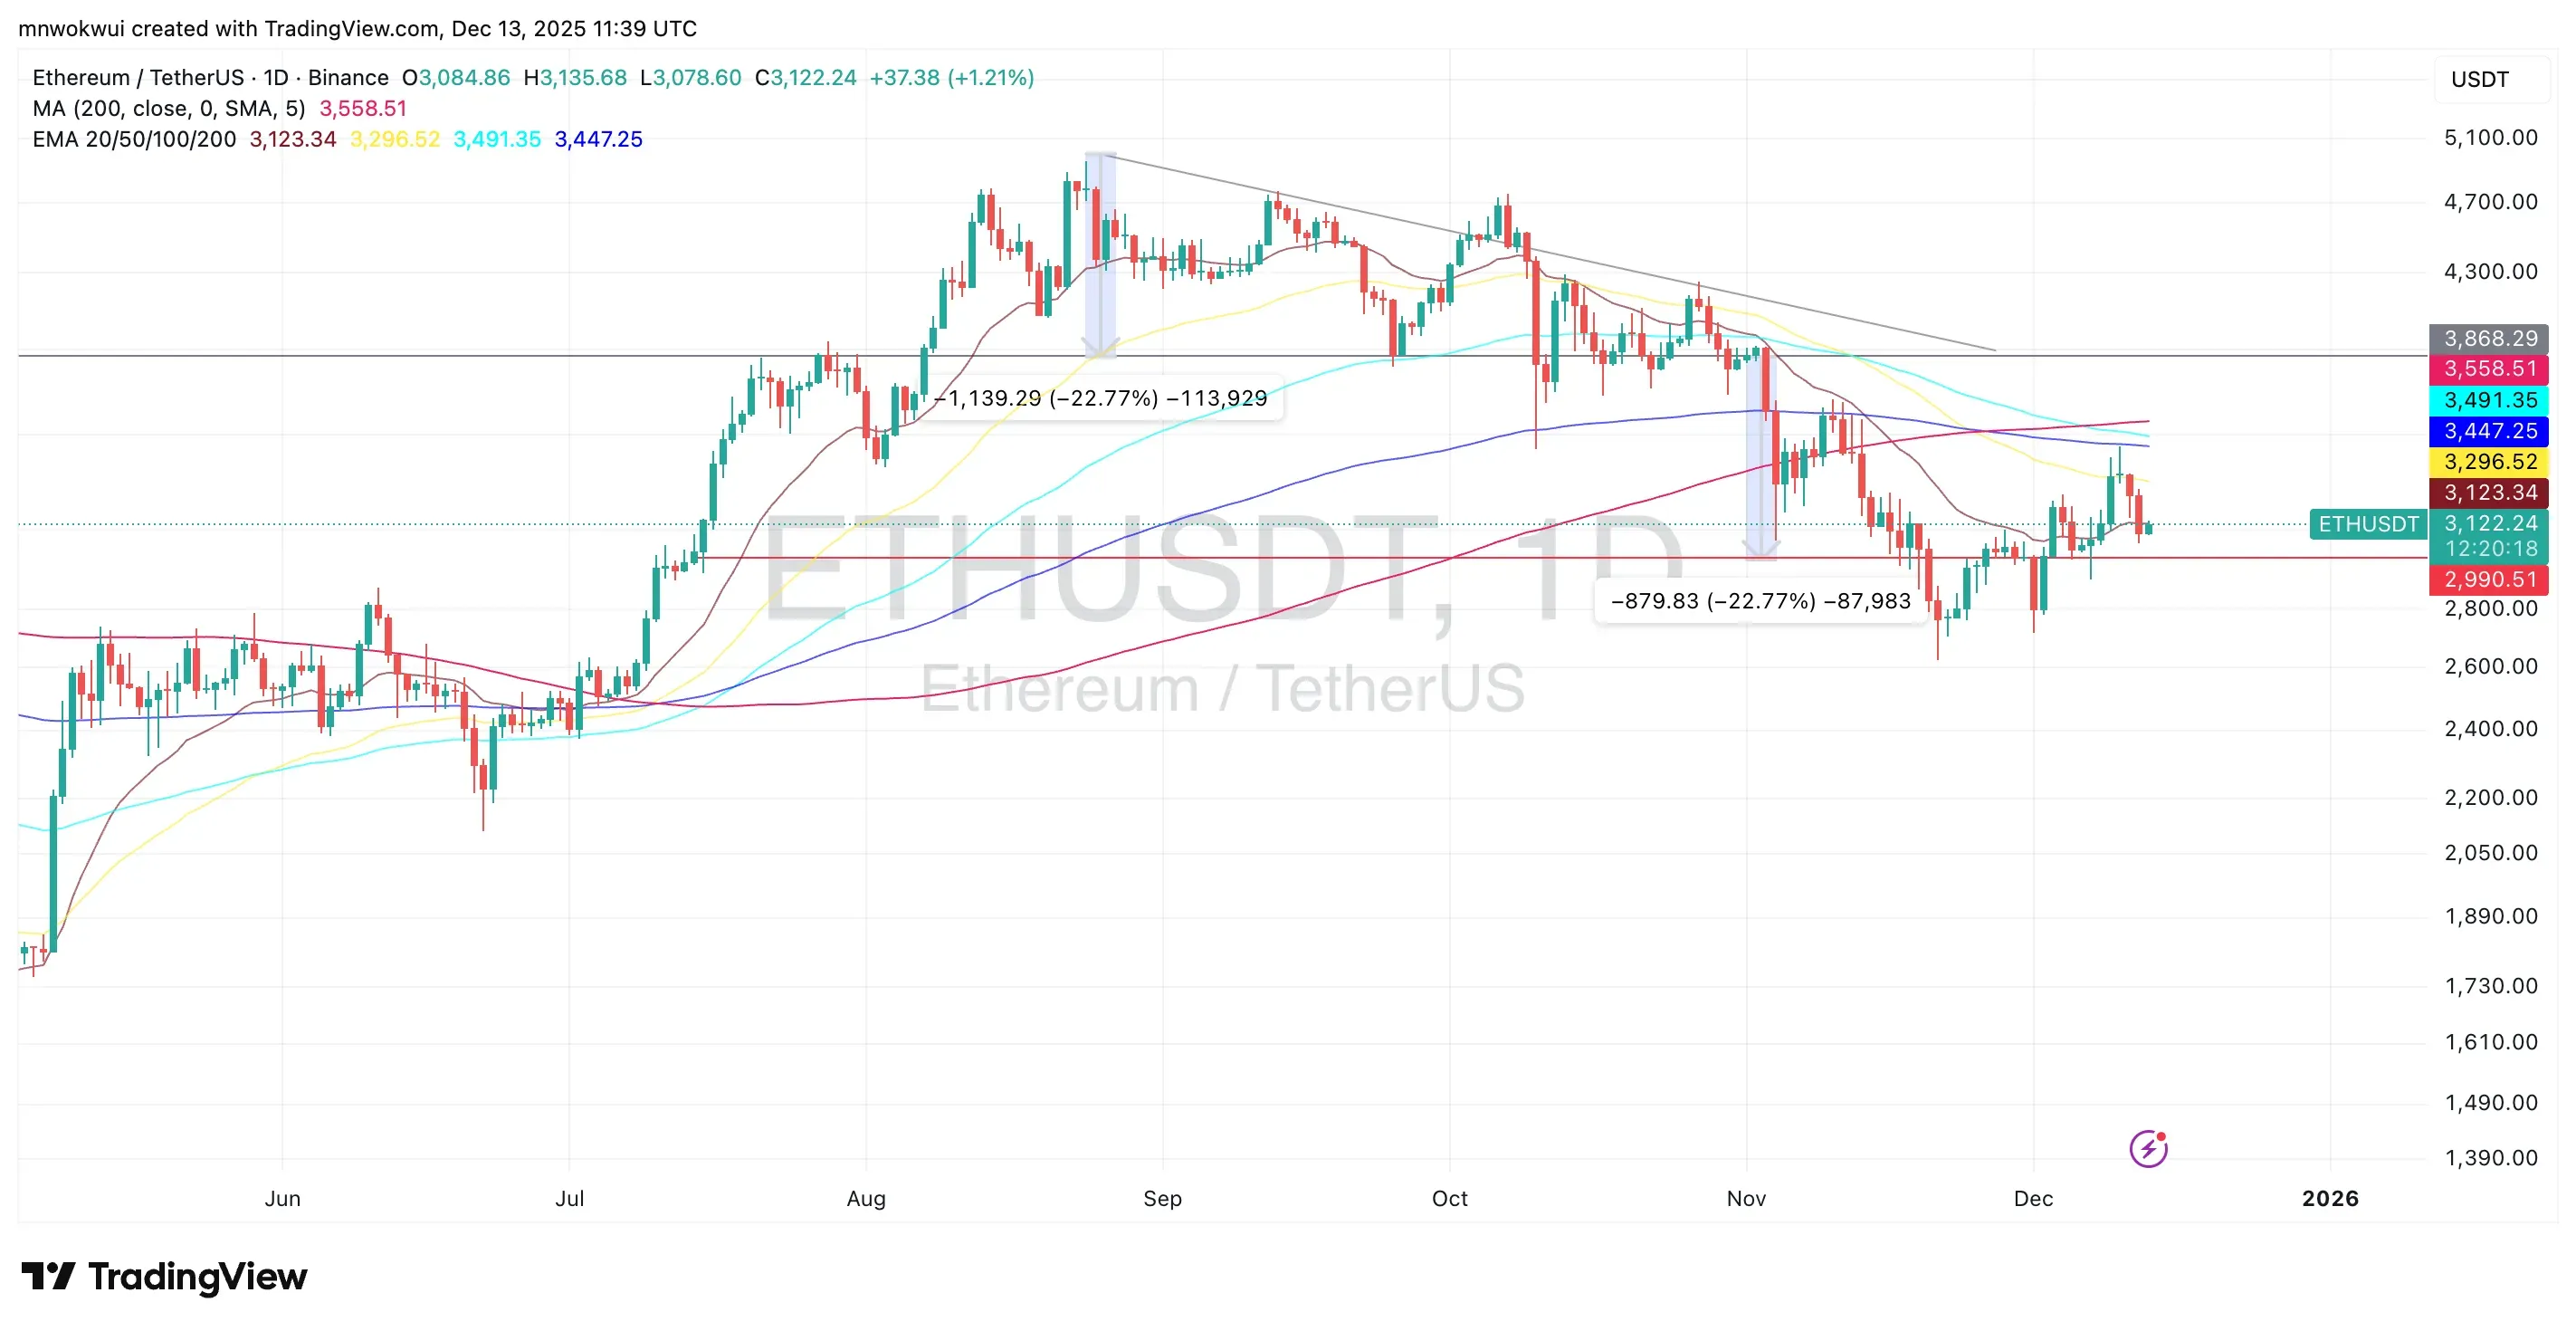
Ethereum’s late-November performance largely mirrored Bitcoin’s weakness but with clearer structural compression. After topping near the $4,700–$4,800 area earlier in the quarter, ETH rolled over and entered a descending channel. The late-November sell-off pushed price below the $3,000 handle before buyers managed to defend the $2,900–$3,000 zone.

Currently, Ethereum is trading around $3,100–$3,150, sitting just below a cluster of moving averages. The 50-day and 100-day EMAs, along with a declining trendline from the October highs, are capping upside attempts near $3,300–$3,500.
Bullish scenario:
A bullish case for ETH hinges on a decisive breakout above $3,500. Such a move would invalidate the descending structure and signal renewed strength, potentially setting the stage for a rally back toward $3,850 and later $4,300. This scenario would likely require broader market confidence to return, particularly from Bitcoin.
Bearish scenario:
If Ethereum fails to reclaim $3,200–$3,300 and slips back below $3,000, downside risks increase sharply. A breakdown from this base could see ETH revisiting the $2,700–$2,800 region, where previous demand emerged in August. Sustained weakness below that level would suggest Ethereum is lagging the market and could underperform in the near term.
Solana (SOL/USDT): Weak Bounce Within a Downtrend
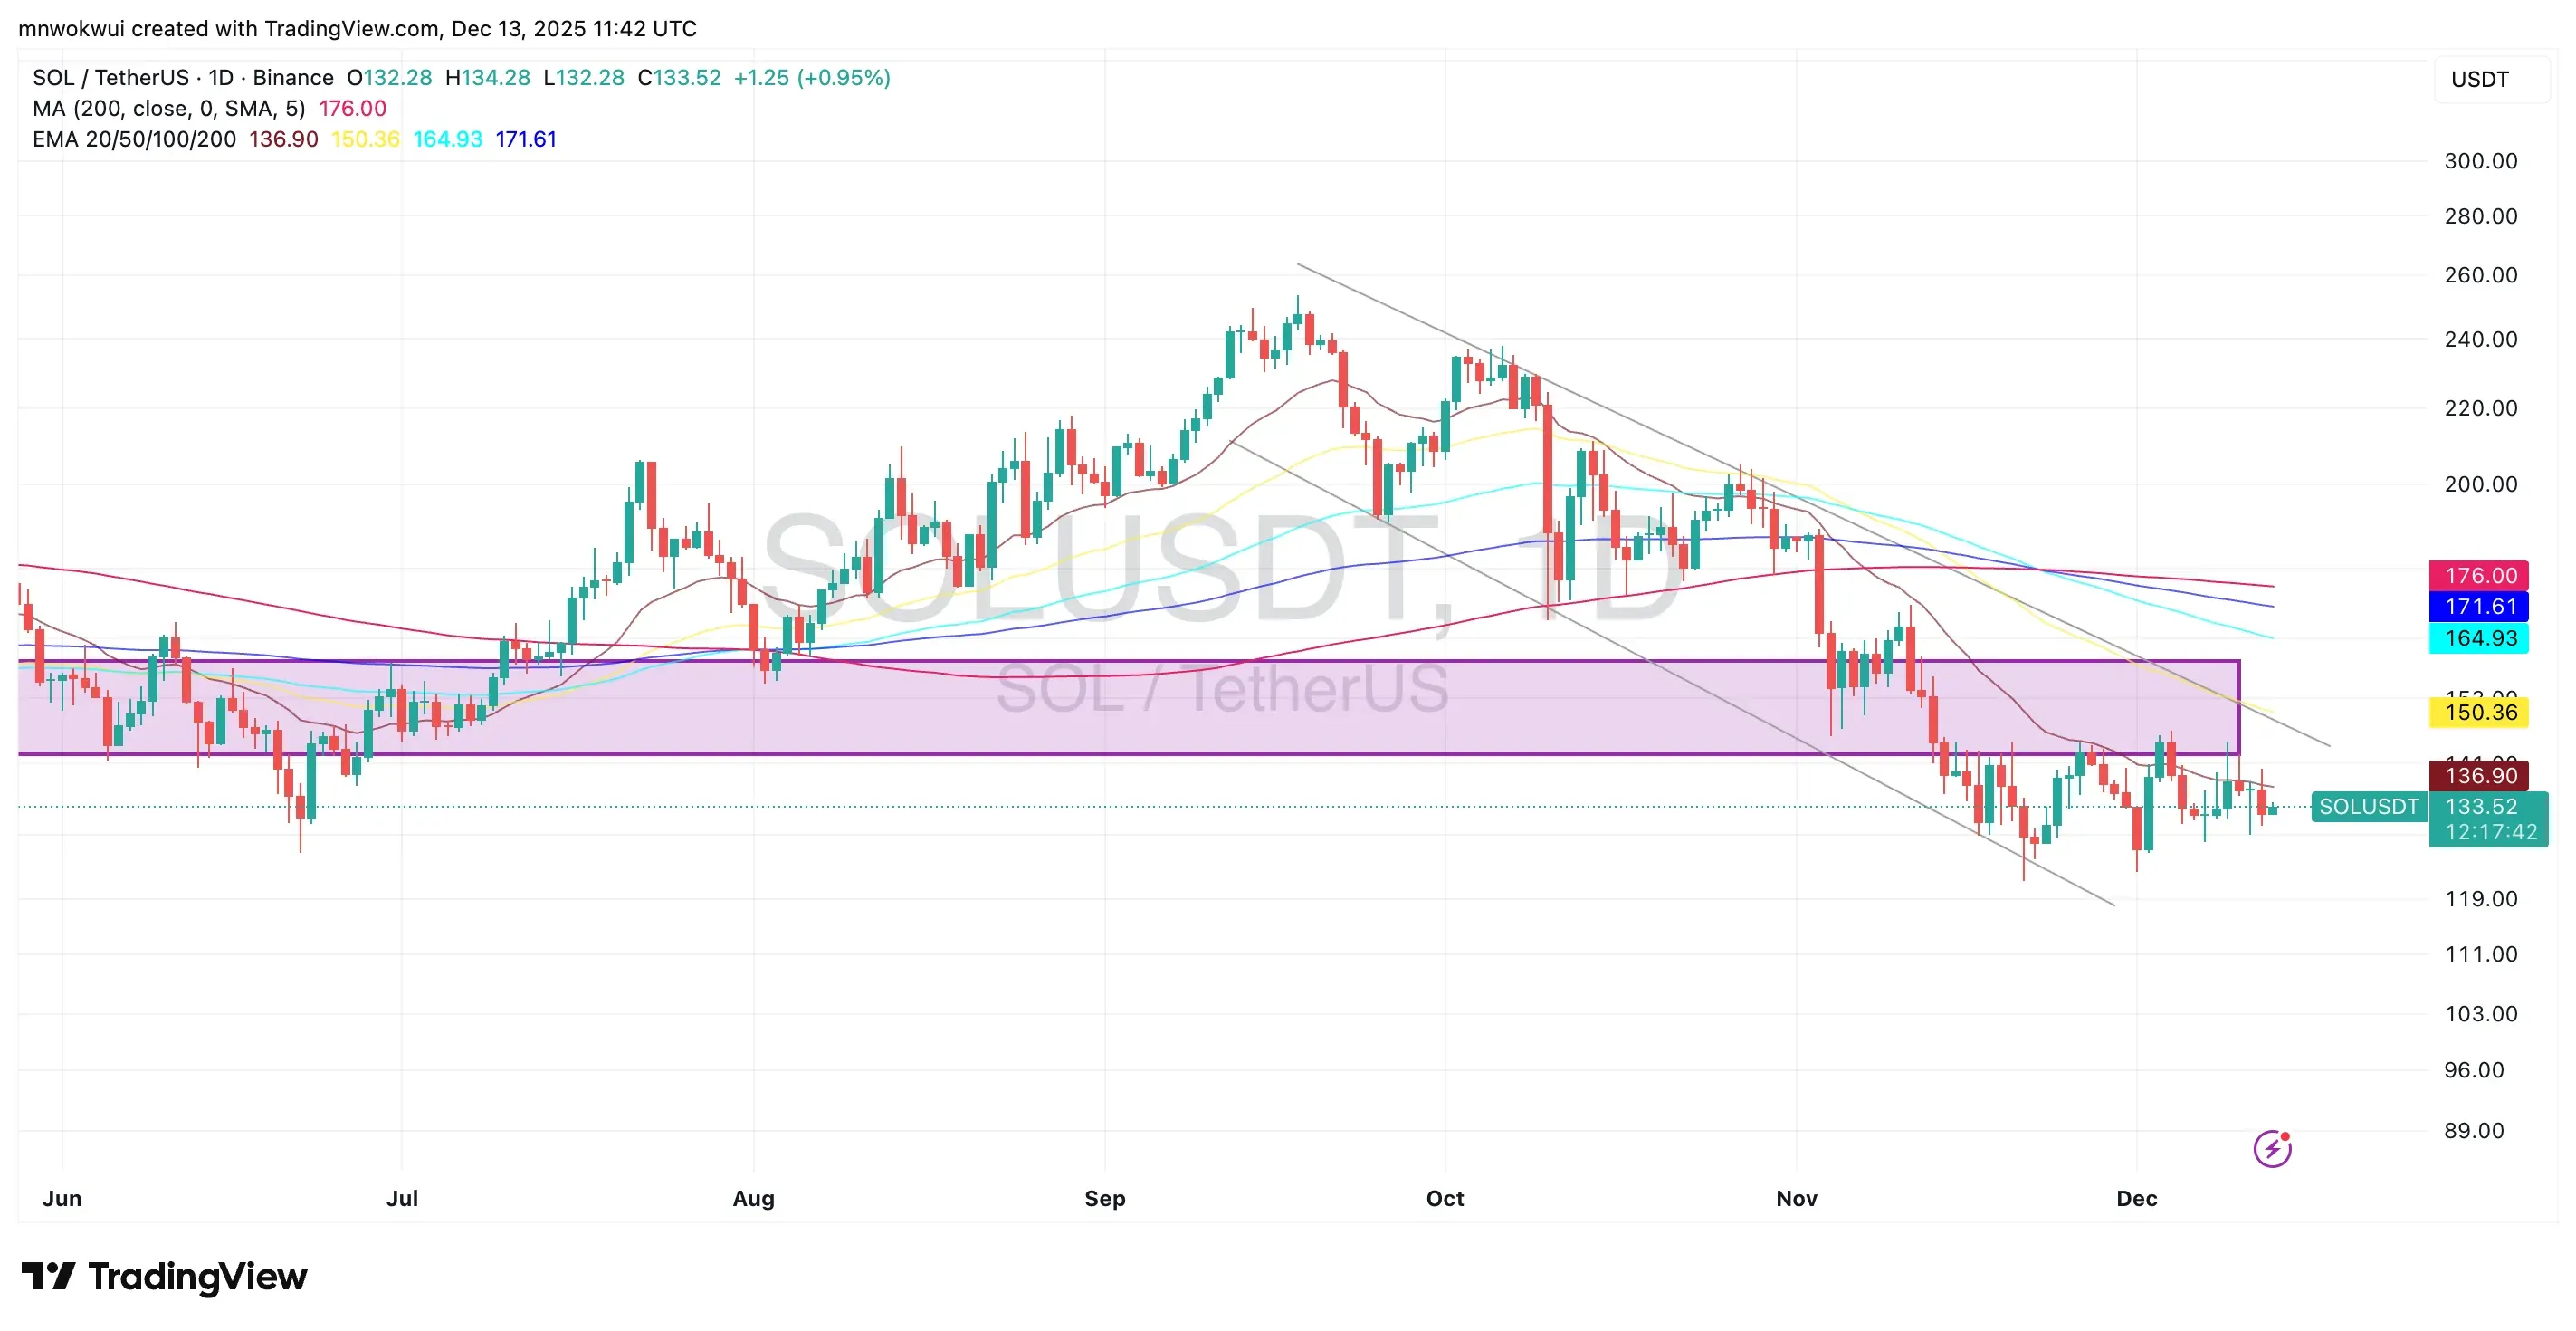
Solana has been one of the weaker large-cap performers since late November. After losing the $150–$160 support zone, SOL accelerated lower within a clearly defined descending channel. The November sell-off pushed price toward the $120 region, where some stabilization has since occurred.

At present, Solana is trading near $133–$135, still well below its key moving averages. The 50-day and 100-day EMAs sit overhead, reinforcing the prevailing bearish structure.
Bullish scenario:
For a meaningful recovery, SOL would need to reclaim the $150 area and break out of its descending channel. A move above $165 would be a stronger confirmation of trend reversal, potentially opening the door to a push toward $175–$180.
Bearish scenario:
If price fails to hold above $130, Solana risks another leg lower. A breakdown below $120 could expose the $105–$110 region, which marks the next notable support on the daily timeframe.
Outlook
Overall, late November marked a clear regime shift for the crypto market. While panic selling appears to have subsided, the charts suggest that Bitcoin, Ethereum, and Solana are still in recovery mode rather than full-fledged uptrends.
Much will depend on Bitcoin’s ability to reclaim lost ground and on broader macro signals following the latest FOMC guidance. Until then, traders may continue to see choppy, range-bound conditions as the market searches for its next decisive move.
Read Next...
Disclaimer
Disclaimer: The views expressed in this article do not necessarily represent the views of BSCN. The information provided in this article is for educational and entertainment purposes only and should not be construed as investment advice, or advice of any kind. BSCN assumes no responsibility for any investment decisions made based on the information provided in this article. If you believe that the article should be amended, please reach out to the BSCN team by emailing [email protected].
Author
 Miracle Nwokwu
Miracle holds undergraduate degrees in French and Marketing Analytics and has been researching cryptocurrency and blockchain technology since 2016. He specializes in technical analysis and on-chain analytics, and has taught formal technical analysis courses. His written work has been featured across multiple crypto publications including The Capital, CryptoTVPlus, and Bitville, in addition to BSCN.
(Advertisement)
Latest News
(Advertisement)
Crypto Project & Token Reviews
Project & Token Reviews
Comprehensive reviews of crypto's most interesting projects and assets
Learn about the hottest projects & tokens


![Are Decentralized Token Folios (DTFs) the Next Index Revolution? [Report]](/_next/image?url=https%3A%2F%2Fstorage.bsc.news%2F3%2FWeekahead_52_6_fc2d07e504.webp&w=1920&q=70)


