News
(Advertisement)


How Low Can ETH Go From Here?

Ethereum trades below $2,000 despite record network activity. Chart levels, flows, and data show how low ETH could still fall.
Soumen Datta
February 6, 2026

(Advertisement)
Table of Contents
Ethereum can still fall toward the $1,500 to $1,800 range if selling pressure continues and demand remains weak. ETH is trading below $2,000 after losing about 30% over the last seven days. This drop is happening even as the Ethereum network records its highest activity level to date, creating a clear gap between usage and price.
What Does The ETH Price Chart Show Right Now?
On the 4-hour chart, ETH remains in a firm downtrend. Price has broken below the $2,000 support zone and has failed to reclaim it on multiple attempts.
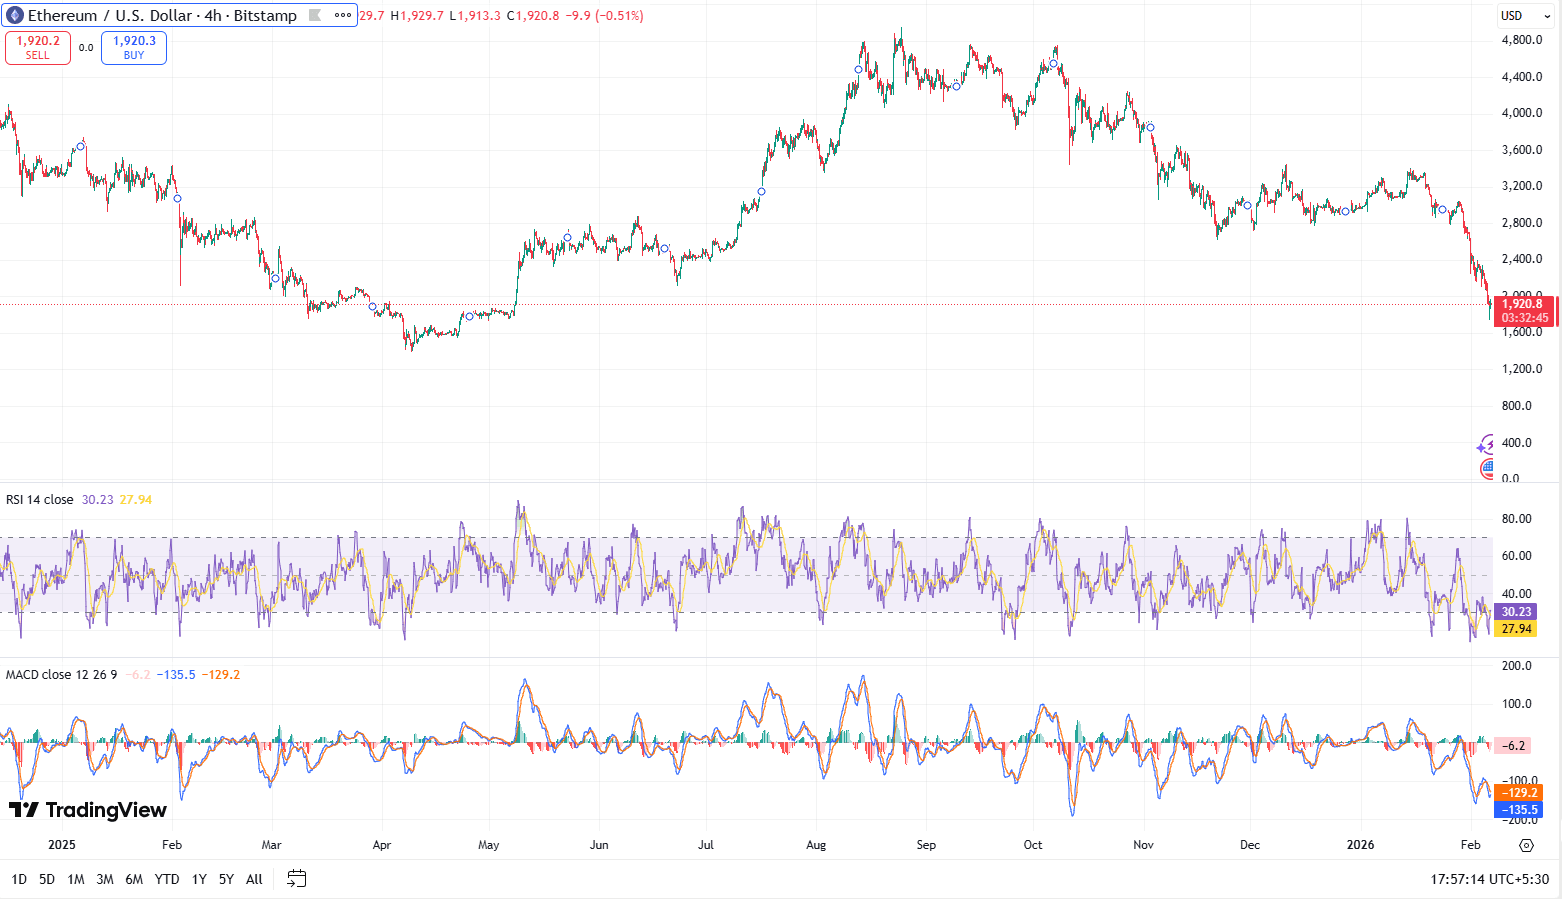
Momentum indicators confirm continued weakness.
- RSI is near 30, which signals oversold conditions but not a confirmed bottom
- MACD remains negative, showing bearish momentum is still active
- The market structure continues to form lower highs and lower lows
Oversold readings alone do not signal a reversal. In past drawdowns, ETH has stayed oversold for extended periods while liquidity continued to exit the market.
Where Are The Key ETH Support Levels?
Several price levels stand out based on historical trading activity and liquidation data.
- $1,800: A psychological level and prior support zone where price has reacted multiple times
- $1,650 to $1,700: A congestion area from earlier accumulation phases
- $1,500 to $1,550: A high-risk liquidation zone flagged by derivatives data
Liquidation risk remains active between $1,509 and $1,800. A move into this range could trigger forced selling from leveraged positions, increasing downside volatility.
Why Is ETH Falling Despite Record Network Activity?
Ethereum is currently experiencing its most active phase on-chain.
According to CryptoQuant, Ethereum Transfer Count, measured by a 14-day moving average, reached a record 1.1 million this month. Transfer count refers to the total number of token movements on the network and is often used as a proxy for usage.
This data points to strong network adoption. However, price is driven by capital flows, not usage alone.
Retail demand has declined sharply. Many traders are closing positions instead of opening new ones. This shift is visible in the derivatives market, where futures open interest dropped to $25.4 billion from $26.3 billion in a single day.
High activity combined with weak demand often leads to price compression rather than immediate recovery.
How Are Institutions And Large Holders Impacting ETH Price?
Large holders have added to near-term selling pressure.
Trend Research, sold 170,033 $ETH ($322.5M) over the last day and still holds 293,121 $ETH ($563M), according to on-chain data. Analysts linked the transfer to selling and loan repayments.
Other notable sales include:
- Stani Kulechov, founder of Aave, selling 4,503 ETH at an average price of $1,857
- Vitalik Buterin selling 2,961.5 ETH for $6.6 million over three days at an average price of $2,228
These transactions are not signs of panic, but they increase circulating supply at a time when demand is weak.
What Is Happening With BitMine And Why It Matters?
BitMine Immersion Technologies is the largest Ethereum-focused treasury company. It holds approximately 4.285 million ETH, or about 3.55% of Ethereum’s circulating supply.
The company accumulated ETH at an estimated cost of $15.65 billion. At current prices, that position is worth about $9 billion, leaving $6 billion to $8 billion in unrealized losses. BMNR stock has fallen 88% from its July peak.
Key details provide context:
- ETH holdings were acquired through equity issuance, not debt
- About 2.9 million ETH is staked, generating an estimated $188 million in annualized staking revenue
- BitMine holds $538 million in cash and added 41,788 ETH last week
CEO Thomas Lee stated that unrealized losses during downturns are part of a long-term treasury strategy, similar to index funds during market declines. Even so, large treasury holders remain a risk factor if liquidity conditions worsen.
Are ETFs Adding More Downside Pressure?
Yes. Spot ETH exchange-traded funds in the US have seen consistent outflows since January 20.
SoSoValue data shows spot ETH ETFs recorded a net outflow of $80.79 million on February 5. Fidelity’s FETH accounted for $55.78 million of that total.
ETF outflows represent passive selling rather than discretionary trading, adding steady pressure without quick reversals.
Is Anyone Accumulating ETH Right Now?
Some long-term investors and whales are accumulating ETH selectively.
On-chain data shows accumulation during price dips, while short-term traders continue to exit. This pattern often appears during mid-cycle corrections rather than final market bottoms.
Accumulation can limit long-term downside but does not stop short-term drawdowns.
How Low ETH Can Go From Here
Based on current chart structure, derivatives data, and on-chain flows, ETH can still test the $1,500 to $1,800 range if selling pressure persists. Momentum remains bearish, demand is weak, and large holders are adding supply to the market.
At the same time, Ethereum’s network activity is at record highs, staking continues to reduce liquid supply, and some long-term investors are accumulating. These factors help stabilize the market over time but do not prevent further downside in the near term.
For now, ETH price is reacting to liquidity conditions, not network usage.
Resources
Ethereum on TradingView: ETH price action
Report by CryptoQuant: Ethereum Transfer Count Surge: A Historical Warning Signal?
Vitalik wallet data on Arkham: Details about ETH movement
Report by Benzinga: Tom Lee's BitMine Down $6B On Ethereum, But Here's Why He Keeps Buying
Read Next...


Frequently Asked Questions
What Is The Next Major Support Level For ETH?
The next major support lies between $1,500 and $1,800, where liquidation risk and historical demand overlap.
Does High Network Activity Mean ETH Should Rise?
No. Network activity shows usage, but price depends on capital inflows, demand, and leverage conditions.
Are ETH Whales Selling Or Buying Right Now?
Both. Some large holders are selling or moving ETH to exchanges, while others are accumulating during price dips.
Disclaimer
Disclaimer: The views expressed in this article do not necessarily represent the views of BSCN. The information provided in this article is for educational and entertainment purposes only and should not be construed as investment advice, or advice of any kind. BSCN assumes no responsibility for any investment decisions made based on the information provided in this article. If you believe that the article should be amended, please reach out to the BSCN team by emailing [email protected].
Author
 Soumen Datta
Soumen has been a crypto researcher since 2020 and holds a master’s in Physics. His writing and research has been published by publications such as CryptoSlate and DailyCoin, as well as BSCN. His areas of focus include Bitcoin, DeFi, and high-potential altcoins like Ethereum, Solana, XRP, and Chainlink. He combines analytical depth with journalistic clarity to deliver insights for both newcomers and seasoned crypto readers.
(Advertisement)
Latest News
March 23, 2026

Two Major Upgrades as InterLink Hits 7M Users
March 23, 2026

Blockchain Gaming is Dead Proclaims Solana Foundation President
March 23, 2026

CLARITY Act Got Its Biggest Break Yet — Is Crypto Law Finally Happening?
March 23, 2026

Google Chrome Got a Critical Security Patch, But Your Crypto Wallet Might Still Be at Risk
March 23, 2026

Is Missouri About to Make XRP an Official State Reserve Asset?
March 20, 2026

Can ASTER Dominate The Perps Sector?
March 20, 2026

Elon Musk is Tweeting About DOGE Again: What's Next?
March 20, 2026

Animoca Brands Invests in Ava Labs to Expand Avalanche in Asia and Middle East
(Advertisement)

Crypto Project & Token Reviews
Project & Token Reviews
Comprehensive reviews of crypto's most interesting projects and assets
Learn about the hottest projects & tokens
Latest Crypto News
Get up to date with the latest crypto news stories and events